Loading website…

Under
construction

Our mobile site is currently under construction.
we apologize for the inconvenience


You can visit our full website on desktop or tablet.


case studies

Our technology in action

Across industries and goals, we deliver the tools that help organisations move from ambition to action. These case studies show the impact of clear insights and decisive action — proof of what happens when the right technology meets focused leadership.

OUR TECHNOLOGY >

FROM BASELINE TO RESULTS

How actionable insights lead to sustainable impact

How actionable insights lead to sustainable impact

Decarbonisation isn’t a straight line — it’s a journey shaped by insight, clarity, and practical action. From understanding your starting point to measuring progress and reporting impact, these stories highlight how data becomes strategy — and strategy becomes real-world results.

Tyndall

Ongoing monitoring and reliable data can sharpen focus, flag inefficiencies, and drive sustained impact over time.

Read More >
AMS

A platform that adapts as they do: AMS solved data challenges fast and gained long-term efficiency.

Read More >
PPG Shannon

As PPG Shannon scaled, they needed more than static reports—live insight kept teams aligned and performance on track.

Read More >
Dublin Airport Authority

Faced with complex systems and bold targets, DAA used scenario planning and lifecycle analysis to map the smartest path forward.

coming soon >

Tyndall

How Tyndall exceeded net zero goals with a 98% gas reduction

Tyndall National Institute aimed to cut fossil fuel use without compromising performance. With OPNBuildings, they gained real-time insight to manage energy use and prioritise upgrades. By replacing gas boilers with heat pumps and tracking seven core indicators, they cut gas use by 98%—well ahead of their 2030 goal. Supported by SEAI EXEED, ISO 50001, and OPNBuildings’ platform, they now avoid 723 tonnes of CO₂ and save 3.6 GWh of energy each year.

98% Gas reduction surpassing 2030 target by 12 years
723 tonnes CO2 saved
3.6 GWh annual energy savings

making progress visible

Data that drives
accountability

Tyndall needed more than data—they needed visibility. By building a long-term monitoring system and tracking seven performance indicators, they moved from reactive management to proactive decision-making. This shift enabled deep emissions cuts and long-term efficiency—proving that the right tools make real progress possible.

Opportunity
analysis
Discover what’s needed
to reach targets
Decarbonisation
Planning
Build adaptive
strategies
Planning Scenarios
Compare strategies
and model outcomes
League Tables
Compare and rank
efficiency by site

clarity drives action

With the right data, Tyndall didn’t just meet targets—they rewrote them.

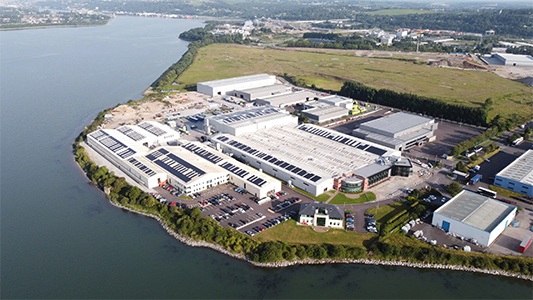
AMS

How AMS is turning ambition into action

Aluminium extrusion is a heavy industrial process—high energy, high emissions, and historically hard to decarbonise. For AMS, a leading manufacturer in this space, the challenge wasn’t a lack of ambition. It was knowing where to begin.

With energy-intensive furnaces, volatile gas prices, and growing regulatory demands, the business needed a way to make its climate targets actionable. The existing systems weren’t built for that. What was missing was a clear line of sight—from ambition to impact.

1MW Rooftop solar
project monitored
100% of SEU’s tracked
24/7 visibility on energy
and emissions

turning ambition into action

Data that moves
with the business

In a sector as energy-intensive as aluminium extrusion, AMS needed more than static reports—they needed live, reliable insight. With OPN, they built a structured system that brings clarity across energy, process and emissions data. Legacy gaps were replaced with high-integrity metering, ISO-aligned tracking, and scenario planning. Solar and water systems are now monitored continuously—keeping AMS accountable and on track toward net-zero.

Glidepath
track progress
in real time
Performance
Indicators
Measure emissions
and energy performance
Decarbonisation
Planning
Build adaptive
strategies
Planning Scenarios
Compare strategies
and model outcomes

clarity drives action

With the right insight, AMS isn't waiting—they're leading.

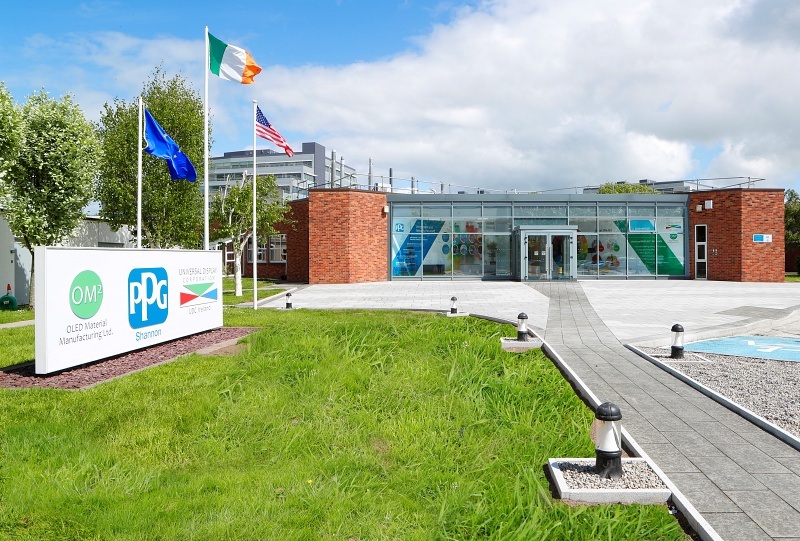
PPG Shannon

How live insight helps PPG manage growth and complexity

When PPG and Universal Display Corporation launched a new OLED manufacturing facility in Shannon, they entered a fast-moving energy landscape. With three stakeholders involved—PPG, UDC Ireland, and OM2—and operations scaling rapidly, aligning everyone around performance wasn’t easy.

Static reports couldn’t keep up. PPG needed a shared, adaptable view of energy use that could evolve alongside the site.

100+ meters tracking
live data
ISO 50.001 principles
applied in practice
24/7 visibility across
operations

TURNING COMPLEXITY INTO CLARITY

Live insight for a site
that never stands still

At PPG Shannon, nothing stays still—equipment changes, loads shift, and teams work in parallel. PPG needed a system that could grow with them. With OPN, they replaced outdated monitoring with live, validated data, expanded metering as the site scaled, and gave teams the visibility to take ownership. ISO 50001-aligned practices became part of daily routines, and clearer insight allowed them to refine targets and track real progress.

Glidepath
track progress
in real time
Performance
Indicators
Measure emissions
and energy performance
Decarbonisation
Planning
Build adaptive
strategies
Planning Scenarios
Compare strategies
and model outcomes

clarity drives action

PPG turned fast growth into focused progress—with tools that scale.

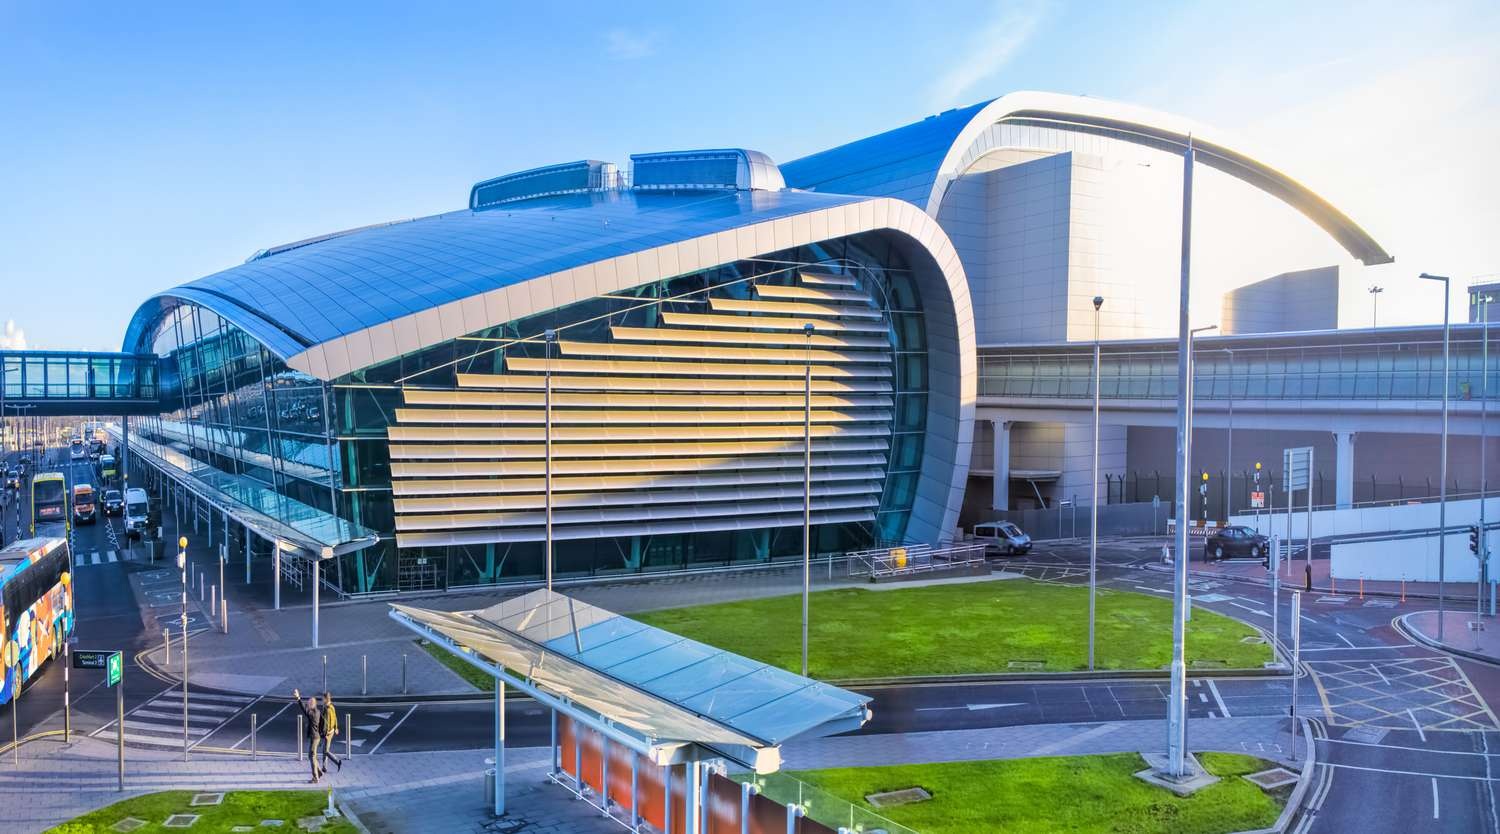
Dublin Airport Authority

98% Gas reduction surpassing 2030 target by 12 years
723 tonnes CO2 saved
3.6 GWh annual energy savings

making progress visible

Data that drives
accountability

Tyndall needed more than data—they needed visibility. By building a long-term monitoring system and tracking seven performance indicators, they moved from reactive management to proactive decision-making. This shift enabled deep emissions cuts and long-term efficiency—proving that the right tools make real progress possible.

Opportunity
analysis
Discover what’s needed
to reach targets
Decarbonisation
Planning
Build adaptive
strategies
Planning Scenarios
Compare strategies
and model outcomes
League Tables
Compare and rank
efficiency by site

clarity drives action

With the right data, Tyndall didn’t just meet targets—they rewrote them.